On November 3, 2026 the ChromiumDev account posted about keeping pages responsive while filtering large datasets. Its first image is titled “Break up long tasks”, the name of one of the skill’s guides. The other two made the pitch: “coding agents don’t always deliver”, and Modern Web Guidance “can help”, so install it “to help your coding agent write more responsive web code”. The demo was a catalogue showing 1,992 of 10,000 books.1
A month earlier I wrote about how that skill works inside, its search, its guides and how Google tests them. That post explained the machinery. It never checked whether the machinery changes what an agent ships, so on November 5 I tested it on the same kind of page. I expected it to help.
The short version: it didn’t. With the skill installed, Claude Code’s search boxes blocked the main thread just as long as without it, about 2.7 seconds over a short typing script. The skill’s search never found its own long-task guide. When I named the guide in the prompt, every agent followed it to the letter, and the yield it adds never ran once.
How I set it up, and the first round that measured nothing
I wanted the rules written down before any result could tempt me, so the protocol came first. I had Claude Code write it in a normal session on my blog repo, then build the harness and run the other agents. Everything I changed after the first run is in that file with the date and the reason.
The task was a static page that lists the first 50 of 10,000 generated books, with a search input and no search. Every agent got the same prompt: add search-as-you-type over title and author, keep the existing markup, no build step. It said nothing about performance.
Two arms, same everything else:
- baseline: Claude Code 2.1.318 with
claude-sonnet-5-5, started with--setting-sources projectso my installed skills don’t load - guidance: the same, with Modern Web Guidance copied into the workspace, pinned to skill version
2026_10_30-58d055df2
Each agent ran headless in a fresh copy of the starter page:
claude -p "$PROMPT" --model claude-sonnet-5-5 --setting-sources project \
  --permission-mode acceptEdits --max-turns 30 --output-format stream-json --verbose \
  --allowedTools Read Write Edit Glob Grep 'Bash(npx -y modern-web-guidance@latest *)' 'Bash(ls *)'
The agents had no browser, so none of them could see how their page behaved.
Each page then ran five times in headless Chrome 156 at 4x CPU throttling on my M3 Pro, while a script typed “the history of”, then “science”, then “ar”, 80 ms per key. The main number is summed blocking time: for every task over 50 ms, the part above 50 ms, added up.3 The second is the worst single interaction, which is what INP reports when a page has fewer than 50 interactions. Good is 200 ms or less, poor is over 500 ms.4
Round one, five agents per arm, failed in a way I hadn’t planned for. Seven of the ten pages capped the list at 50 matches. Three baseline pages did it, and four with the skill. A page that only ever shows 50 books never blocks, and it also isn’t the task, because the ChromiumDev demo shows every match. My prompt had let the agents skip the hard part.
So I added one sentence, “Show every match, not just the first few”, wrote that change into the protocol before running anything, and did eight agents per arm.
Round two: no difference, and Modern Web Guidance’s search missed its own guide
All 16 pages filtered correctly. Here are the medians across the eight pages in each arm:
            summed blocking   worst interaction
baseline    2,715 ms          1,320 ms
guidance    2,729 ms          1,328 ms
That’s a tie, and both are deep in INP’s poor band. Fifteen of the sixteen pages blocked for between 2.4 and 3 seconds.
The skill was loaded in every guidance run, and six of the eight agents ran a search. Every query was some version of the task: “filter list as you type”, “filter list as typing”, “filter list while typing”. Each search returned ten guides, mostly about forms, html, accessibility, validation, menus and autofill, plus two WebMCP ones. The skill has a guide called break-up-long-tasks, and none of those searches returned it. I ran the same queries on the same CLI version (0.0.197) afterwards and got the same lists:
export DISABLE_TELEMETRY=1
npx -y modern-web-guidance@latest search "filter list as you type" --skill-version 2026_10_30-58d055df | jq -r '.[].id'
# forms html selector-atrule-combinations menu accessibility validate-input-after-interaction ...
npx -y modern-web-guidance@latest search "break up long tasks" --skill-version 2026_10_30-58d055df | jq -r '.[].id'
# break-up-long-tasks performance schedule-tasks-by-priority ...
Even “keep typing responsive while filtering 10000 items” doesn’t find it. Only a query that names the technique does.
The skill did change one thing. Two agents read its accessibility guide and added a live region that announces the result count to screen readers, and they were the only pages in round two that did. Two pages is too few to call a result, and in round one three baseline pages added the same kind of live region without the skill, so I can’t credit it to the skill.
The fastest page in round two had no skill at all. One baseline agent wrapped the update in requestAnimationFrame, so a burst of keystrokes collapses into one render per frame:
search.addEventListener('input', () => {
  cancelAnimationFrame(frame);
  frame = requestAnimationFrame(update);
});
Its summed blocking was 1,320 ms, half the others, and its worst interaction was 560 ms. Better than the rest, still poor.
Naming the guide, and the yield that never runs
That left two explanations: the guide never gets retrieved, or its advice doesn’t fix this page. To tell them apart I added a third arm, written into the protocol first. Same setup as guidance, plus one line in the prompt telling the agent to run npx -y modern-web-guidance@latest retrieve "break-up-long-tasks" before writing code. This arm names the technique, so it says nothing about the skill’s search and I kept it out of the comparison.
All eight agents retrieved the guide, and all eight wrote what it shows: a 50 ms deadline checked inside the loop and scheduler.yield() with a setTimeout fallback for Safari.5,6 Each also added a counter the guide doesn’t have, which drops a render once a newer keystroke arrives. Half of them said typing would stay responsive. All eight also said, correctly, that they hadn’t run it in a browser.
The median was 2,710 ms. Same as the other two arms.
That looked wrong enough that I checked the harness before the pages. It started typing a fixed 800 ms after load, and I suspected the first render of all 10,000 books was leaking into the typing window. It wasn’t, on the page I checked, but I changed the harness to wait for a full second with no change and no long task anyway, and measured every page again. No page moved by more than 462 ms and none changed its correctness. The numbers in this post are the second set.
Here’s the loop, from one of the eight:
let deadline = performance.now() + 50;
let html = '';
for (const book of list) {
  html += renderBook(book);
  if (performance.now() >= deadline) {
    results.insertAdjacentHTML('beforeend', html);
    html = '';
    await yieldToMain();
    if (token !== renderToken) return;
    deadline = performance.now() + 50;
  }
}
if (html) results.insertAdjacentHTML('beforeend', html);
The deadline only times the string building, and even 9,656 HTML strings took less than 50 ms to build. So the deadline never trips, the yield never runs, and every keystroke inserts the whole list at once after the loop. The harness log shows it on every page I checked: the result list jumps straight to its full count (9,656, then 5,917, down to 1,022) in one change per keystroke. The guide’s example has a processItem(item) in that spot, which fits heavy CPU work. On this page the heavy part comes after the loop.
My harness splits each slow frame into script time and style and layout time. On these pages most of each frame fit neither: about 2,400 ms against about 650 ms of script per page. So I traced one keystroke that took the list from 10,000 books to 9,881:
EventDispatch keypress  387 ms
  EventDispatch textInput  387 ms
    EventDispatch input  102 ms   (the search handler, 42 ms of it parsing HTML)
    UpdateLayoutTree      52 ms
    Layout               229 ms
The handler is a quarter of it. The rest is the browser working out style and layout for nearly 10,000 new list items, inside the same keystroke event, right after the handler returns. A baseline page traced the same way: 66 ms of style, 270 ms of layout. Long animation frame timing reports time spent in scripts and in the frame’s rendering step, which starts at renderStart.7 This layout runs inside the keystroke event, outside both, so my harness could only file it as “other”. web.dev’s page on DOM size describes this cost: a big DOM update can set off “very costly layout, styling, compositing, and paint work”.8 A performance.now() check inside the loop can’t see any of it, because it all happens after the loop is done.
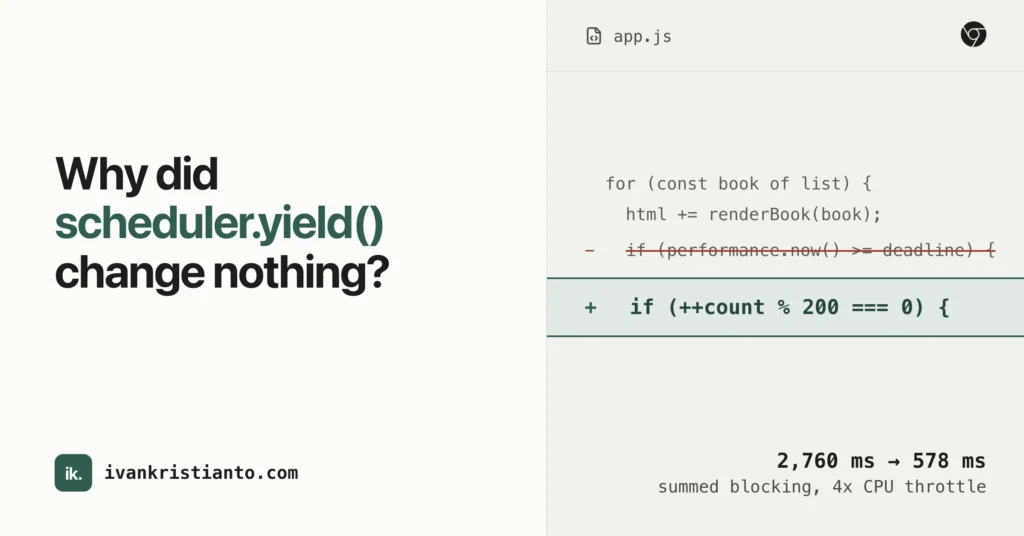
To check that the yield was in the wrong place and the technique itself was fine, I copied one of the eight pages and changed its flush condition, so it inserts every 200 items instead of when 50 ms has passed:
+  let count = 0;
   for (const book of list) {
     html += renderBook(book);
-    if (performance.now() >= deadline) {
+    if (++count % 200 === 0) {
Same harness, five runs: summed blocking went from 2,760 ms to 578 ms, the worst interaction from 1,344 ms to 336 ms, and the results were still correct. It still has five long tasks, the longest 349 ms, which I haven’t traced. That change came after the results, from my own Claude Code session, not from any of the agents under test, and 200 is just a number I picked.
You can try both pages yourself in the demo: the agent’s version and the fixed one, each with a small meter for blocking time and the worst interaction. Turn on 4x CPU throttling in DevTools to see what the test saw. The protocol, harness, all 34 transcripts and the results are in the repo.
What I haven’t tested, and what’s next
This is one task, one model, one agent, one machine, and eight pages per arm. The throttle stands in for a slower phone and isn’t one. I only measured Chrome, tracing a single keystroke on two pages rather than all of them. I also haven’t yet tested rendering fewer nodes at once using virtualization or content-visibility: auto to skip off-screen content.9 Either would cut the layout work itself instead of spreading it out, and on a list this long that’s probably the better fix. All 34 agent runs cost $5.98 in API usage.
Two things I want to do next:
- Write up how to build an agent skill with evals and a grader, using this harness as the example, because a skill’s search can’t be judged without one.
- Run the same protocol on another model or another agent, since everything here is one model’s behavior.
If you use Modern Web Guidance or any skill like it:
- Don’t count on the agent’s search to find the performance guide. Name the guide in your prompt or your project’s instructions.
- Check that a yield sits between the expensive steps. If it only splits cheap JavaScript and the DOM insert comes after it, nothing changes.
- Measure the page, or give the agent a way to. Four agents in the third arm said typing would stay responsive, and the page blocked for nearly three seconds.
Sources
- 1 https://x.com/ChromiumDev/status/2117647994304819595 ↑
- 2 https://github.com/GoogleChrome/modern-web-guidance ↑
- 3 https://web.dev/articles/optimize-long-tasks ↑
- 4 https://web.dev/articles/inp ↑Source 4 https://web.dev/articles/inp
- 5 https://github.com/GoogleChrome/modern-web-guidance/blob/650eb83619134adb947b1ee8755e6511270bc444/skills/modern-web-guidance/guides/performance/break-up-long-tasks.md ↑
- 6 https://developer.mozilla.org/en-US/docs/Web/API/Scheduler/yield ↑
- 7 https://developer.mozilla.org/en-US/docs/Web/API/PerformanceLongAnimationFrameTiming ↑
- 8 https://web.dev/articles/dom-size-and-interactivity ↑
- 9 https://developer.mozilla.org/en-US/docs/Web/CSS/content-visibility ↑